The animation of GOES-17 visible imagery (Band 2, 0.64 µm), above, (created at the CSPP Geosphere site) shows the characteristic signal of Sun Glint — the moving bright region. Sun glint (also discussed on this blog here, here, here, here and — for moonglint: here!) occurs when radiation from the Sun reflects off the ocean surface and is detected by the satellite sensor, in this case the GOES-17 ABI. On the day displayed (17 November), this reflection was pronounced because of light winds and flat seas. The flatter the sea, the more pronounced and intense the reflection; a useful analogy is flat and wrinkled aluminum foil for flat and wavy seas, respectively. You would expect to see a more concentrated reflection off the flat aluminum foil.
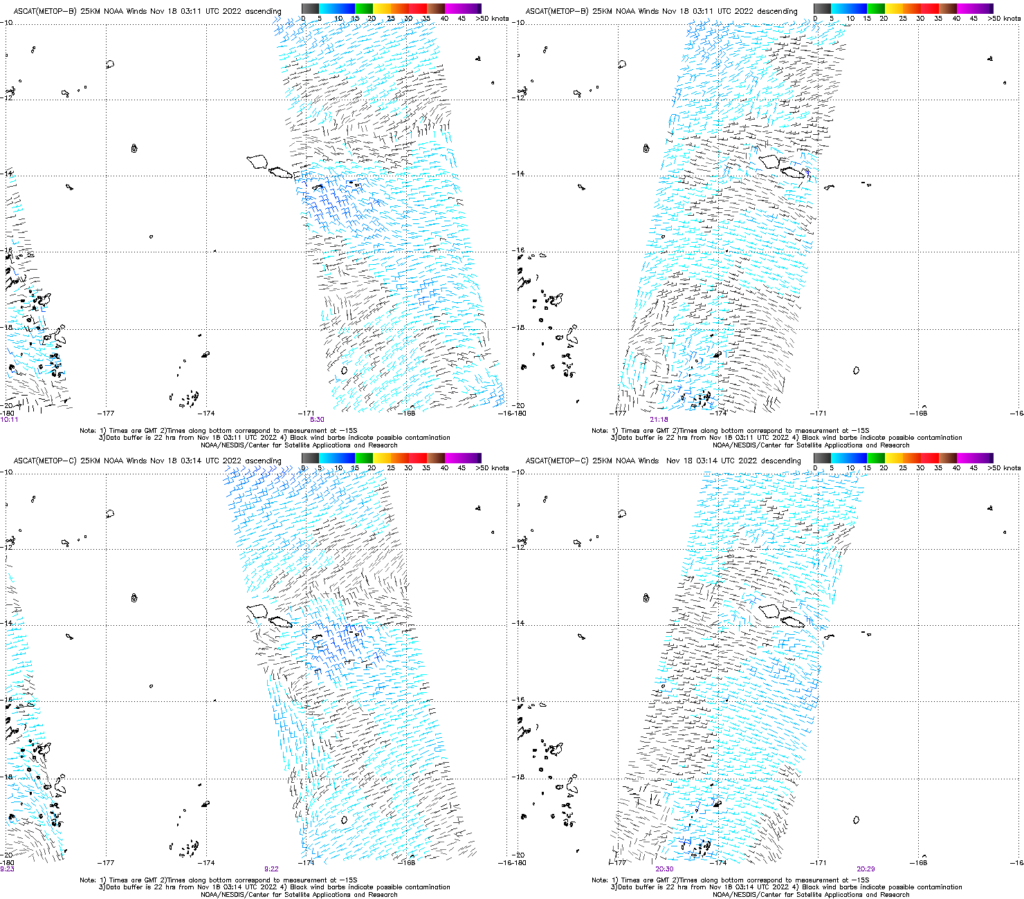
How light were the winds? MetopB and MetopC scatterometer winds, shown in tandem below, from 17 November (from this site), show very light winds to the northeast of the Samoan islands.
Conditions that support concentrated sun glint will also affect the computed sea-surface temperatures (SSTs). That is shown below. Note how warm the SSTs become (>93oF at 0100 UTC)!
Should you believe the very warm SST values? If the seas are flat and winds are near calm, the surface skin of the ocean can become very warm, because mixing in the upper inches of the ocean is minimal absent forcing by winds and waves. The SST algorithm incorporates information from the shortwave IR band (Band 7 on ABI at 3.9 µm) and does account for sun glint (see pp 27-28 in the Algorithm Theoretical Basis Document). The image below shows 0100 UTC Visible (0.64 µm) on the left, Shortwave IR (3.9 µm) in the middle and computed SSTs on the right.
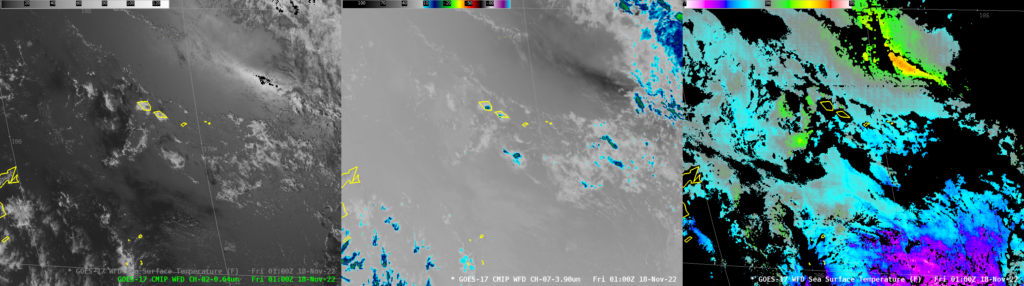
In winds are very light, expect to see warmer SSTs than in surrounding waters where winds are stronger (and vertical mixing in the ocean is therefore greater). However, pay attention if an increase in SSTs accompanies sun glint. The difference of 5oF shown above is likely contamination from reflected solar insolation.


